
Introduction
In the rapidly evolving landscape of software development, clear communication is just as critical as clean code. Yet, one of the most persistent challenges teams face is visualizing complex system architectures in a way that is both comprehensive and accessible to all stakeholders—from developers and architects to product managers and business leaders.
Enter the C4 Model. Developed by Simon Brown, the C4 model provides a hierarchical set of diagrams to describe software architecture at different levels of detail: Context, Container, Component, and Code. However, manually creating and maintaining these diagrams can be time-consuming and error-prone.
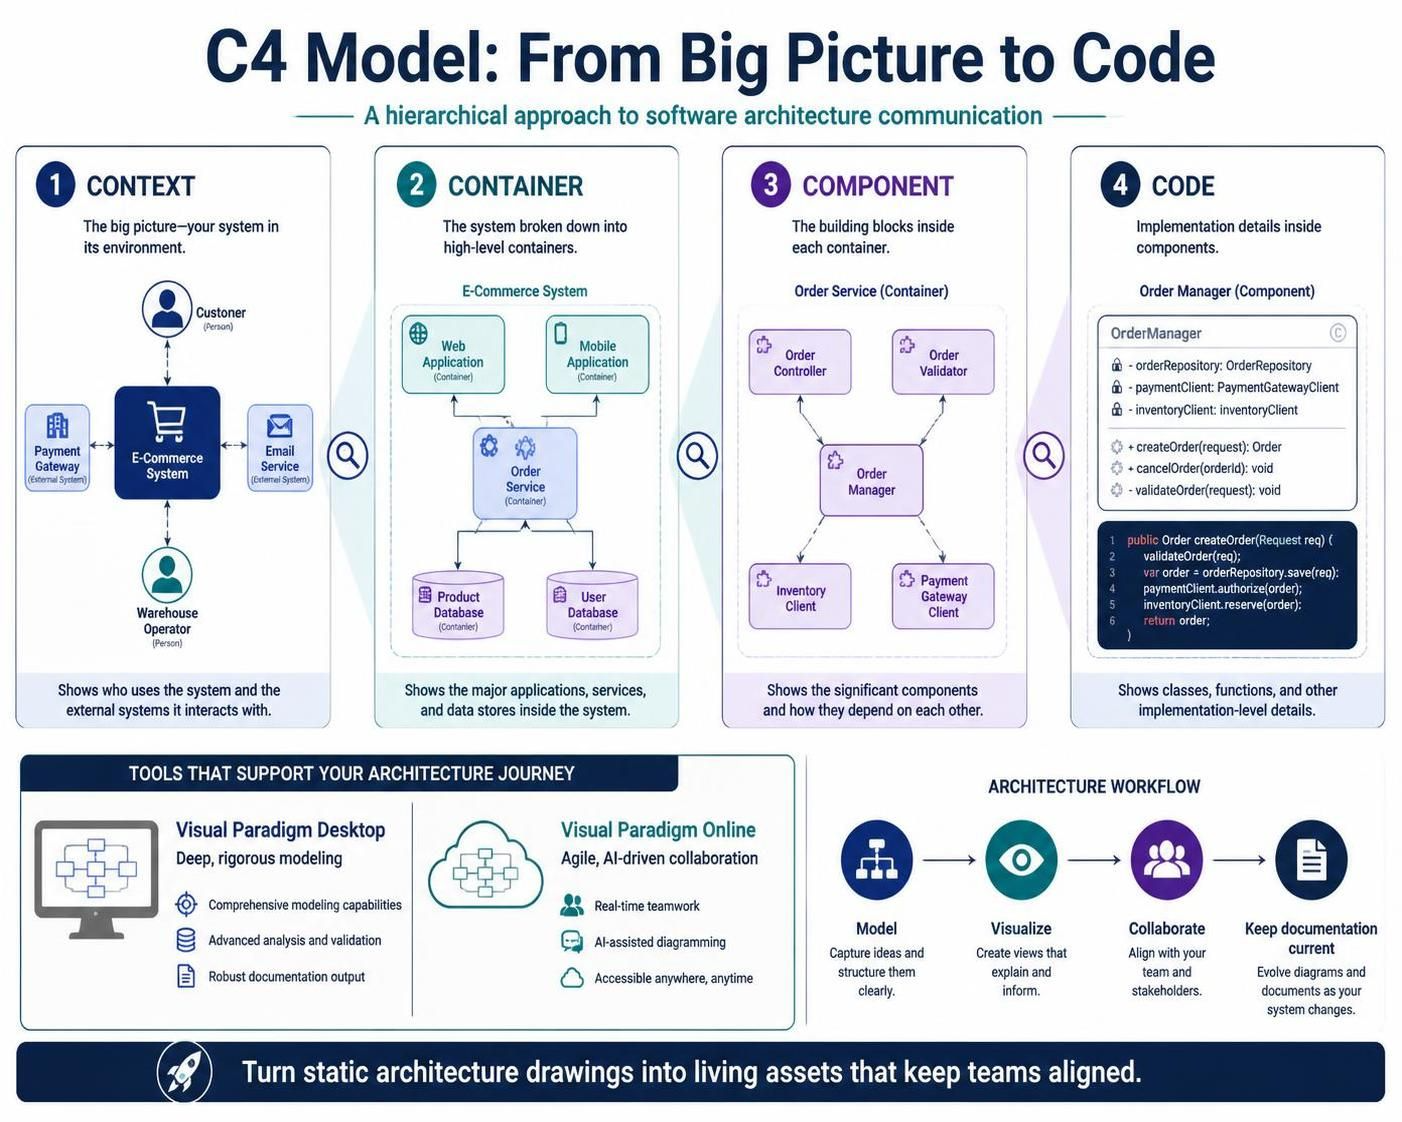
This is where modern tooling makes all the difference. Visual Paradigm has emerged as a leading solution, offering two powerful platforms—Visual Paradigm Desktop for deep, rigorous modeling and Visual Paradigm Online for agile, AI-driven collaboration. This guide explores how leveraging an AI C4 tool and a professional C4 diagram tool can transform your architectural documentation from static drawings into dynamic, living assets that keep your entire team aligned.
Visual Paradigm Desktop: The Architect’s Toolkit
Built for rigorous software architecture. When you need deep control, offline capability, and a full-fledged C4 modeling environment.
Professional C4 Modeling
Go beyond simple drawing. Our C4 modeling tool is designed for speed and precision, with full support for the complete C4 model hierarchy.
-
6 C4 Diagram Types: System Context, Container, Component, System Landscape, Dynamic, and Deployment diagrams.
-
Custom Attributes: Use stereotypes and tagged values to add custom data to your model elements.
Drill Down with Sub-Diagrams
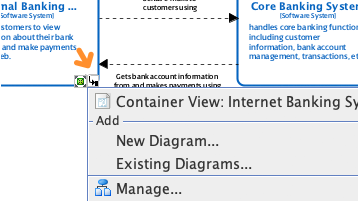
One of the most powerful features of the C4 model is its ability to decompose complexity. With Visual Paradigm Desktop, you can seamlessly drill down from a high-level system view into specific containers, and further into individual components. This creates a traceable hierarchy of diagrams, ensuring that every detail is connected to the broader architectural vision.
Resource-Centric Modeling
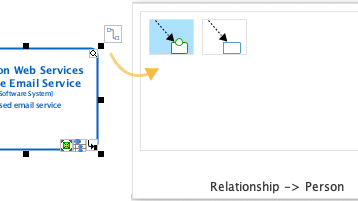
Efficiency is key in enterprise environments. Visual Paradigm’s resource-centric UI allows you to create and connect C4 elements with one-click smart magnets. This intuitive interface reduces the friction of diagram creation, allowing architects to focus on logic and structure rather than manual alignment.
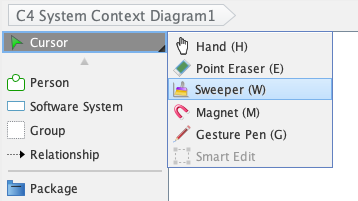
Smart Sweeper
We’ve all been there: a diagram that starts clean but becomes messy as elements are added and moved. The Smart Sweeper feature automatically aligns, distributes, and organizes messy diagrams into a clean, professional layout instantly. This ensures your documentation always looks polished and readable.
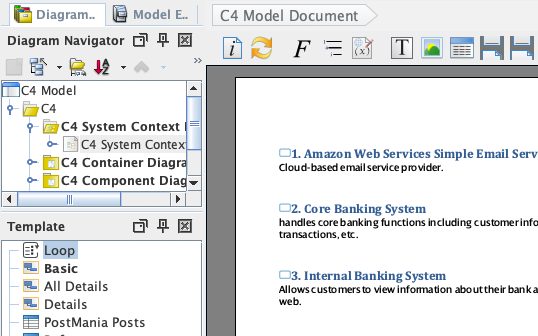
Full Lifecycle Support
C4 modeling doesn’t exist in a vacuum. Manage the entire lifecycle of your architecture with integrated team collaboration and documentation tools.
Team Collaboration
Work as a team with version control. Annotate diagrams and discuss changes with threaded comments, ensuring that feedback is contextual and actionable.
Documentation & Export
Use Doc. Composer to generate detailed specifications directly from your models. Publish your project as an interactive website with Project Publisher, making your architecture accessible to stakeholders who may not have access to the modeling tool itself.
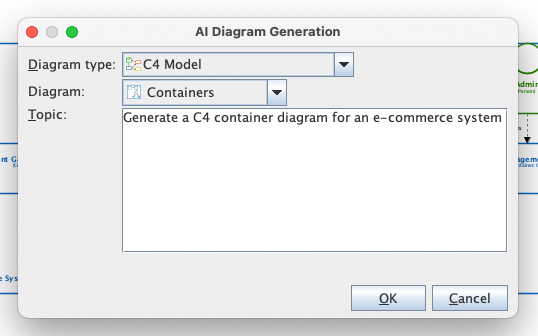
AI-Aided Architecture
Even on desktop, you aren’t alone. Use our integrated AI to jumpstart your design process and generate C4 diagrams with AI.
“Generate a C4 Container Diagram for an e-commerce system”
Simply type a description, and the AI generates a professional C4 diagram for you.
-
Instant diagram generation
-
Supports all 6 C4 diagram types
Bonus Access: VP Desktop users with active maintenance enjoy full access to the cloud-based C4 PlantUML Studio AND the powerful AI Diagramming Chatbot.
Key Concepts in C4 Modeling
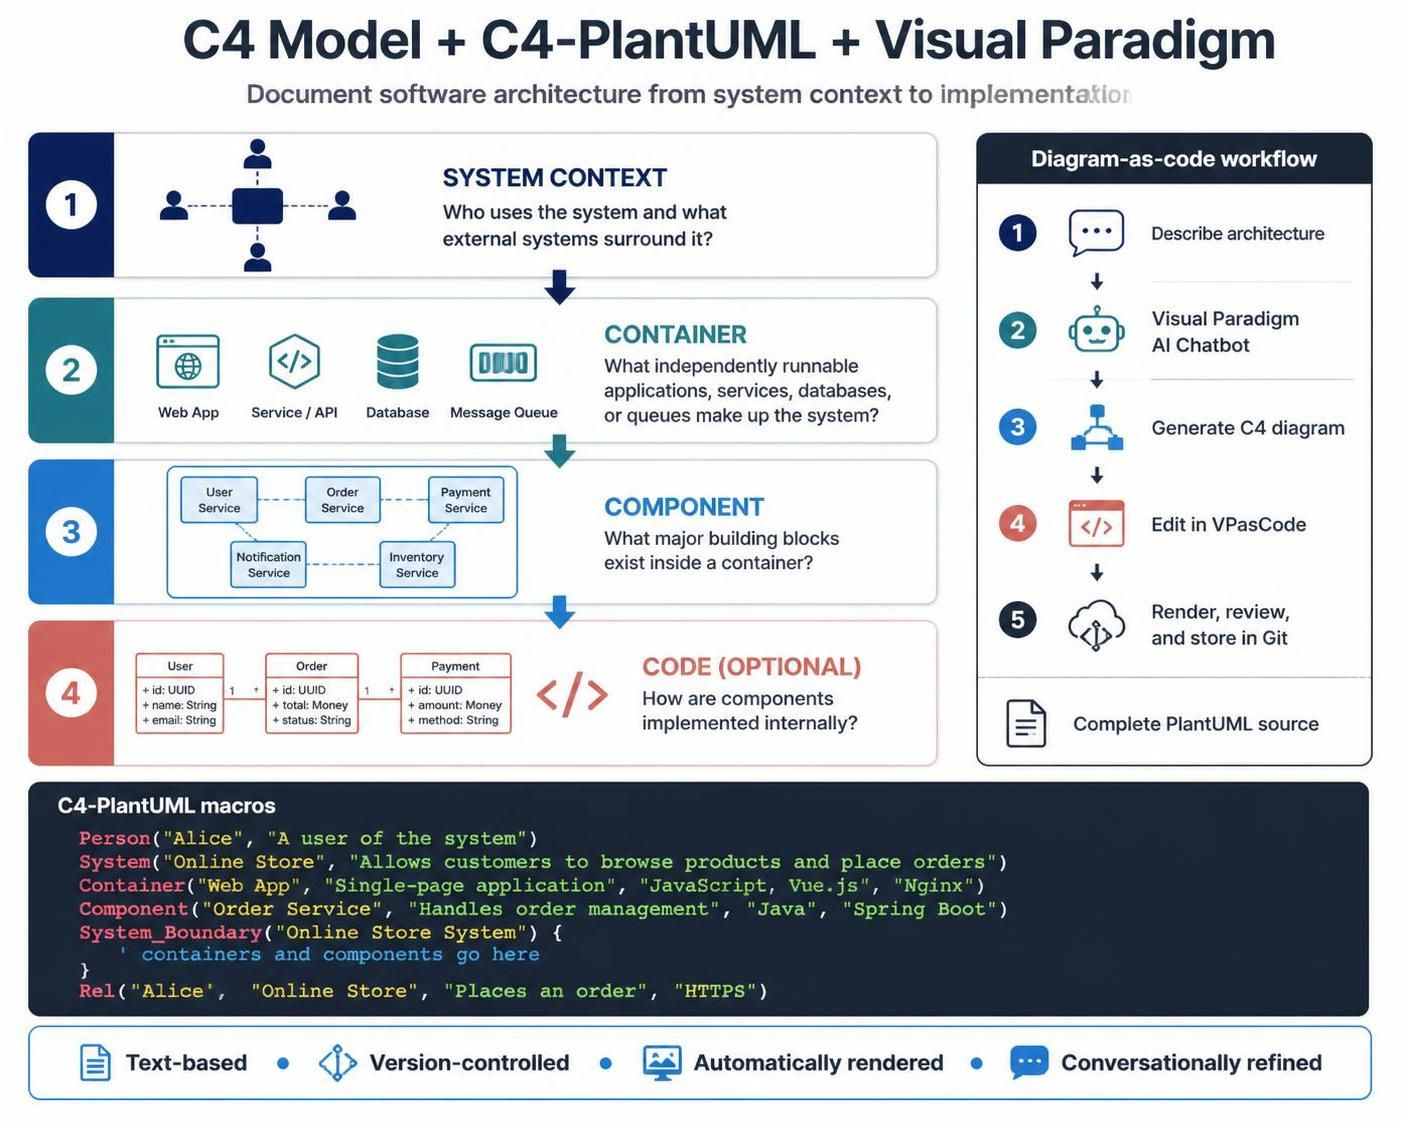
To effectively use any C4 modeler, it’s essential to understand the four primary levels of abstraction:
-
Level 1: System Context Diagram
-
Purpose: Shows the system in scope and how it interacts with users and other external systems.
-
Audience: Non-technical stakeholders, business analysts, and new team members.
-
Example: A diagram showing an “E-Commerce Platform” interacting with “Customers,” “Payment Gateway,” and “Shipping Provider.”
-
-
Level 2: Container Diagram
-
Purpose: Zooms into the system to show the high-level technology choices (containers) such as web applications, mobile apps, databases, and microservices.
-
Audience: Developers, architects, and operations teams.
-
Example: Breaking down the “E-Commerce Platform” into a “Web App,” “API Service,” “Product Database,” and “Order Queue.”
-
-
Level 3: Component Diagram
-
Purpose: Drills into a container to show its internal building blocks (components) and their responsibilities.
-
Audience: Software engineers and technical leads.
-
Example: Inside the “API Service,” showing components like “Authentication Module,” “Product Catalog Service,” and “Order Processing Logic.”
-
-
Level 4: Code Diagram (Optional)
-
Purpose: Maps components to actual code structures (classes, interfaces). Often generated automatically via IDE plugins.
-
Audience: Developers working on specific modules.
-
Diagram Examples
Visualize your system with C4 diagrams.
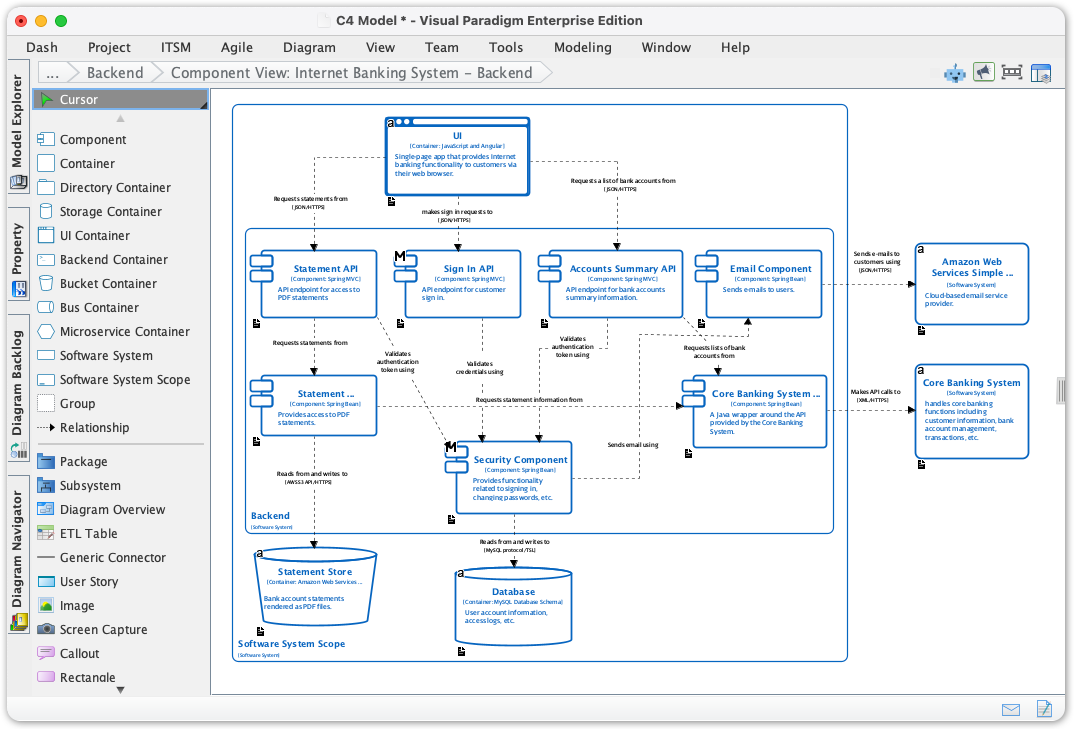
This C4 component-level diagram for the backend of an Internet Banking System. It shows the backend broken into smaller parts and how those parts interact with data stores and external services.
-
Large outlined area: the Internet Banking System’s backend boundary.
-
Boxes inside it: backend components—likely handling functions such as user requests, authentication/security, and banking operations. The small text is too blurry to identify every component name reliably.
-
Cylinders at the bottom: databases or other persistent data stores used by the backend.
-
Boxes to the right: external systems or services, including what appears to be Amazon Web Services and a Core Banking System.
-
Arrows and dashed connectors: communication or dependencies between components and systems. Their labels likely describe the data or calls exchanged.
In short, the diagram illustrates how the banking backend’s internal components connect to stored data and external services. The exact component names and arrow labels aren’t legible enough here to interpret confidently.
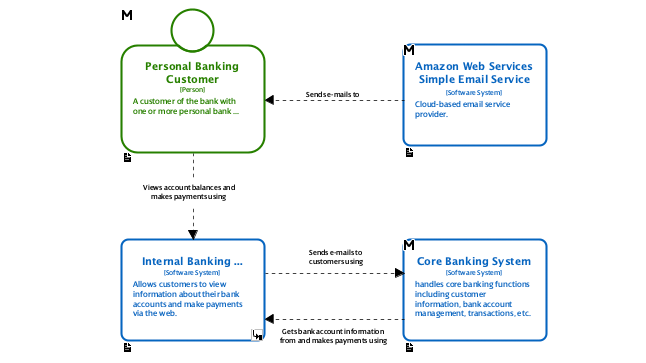
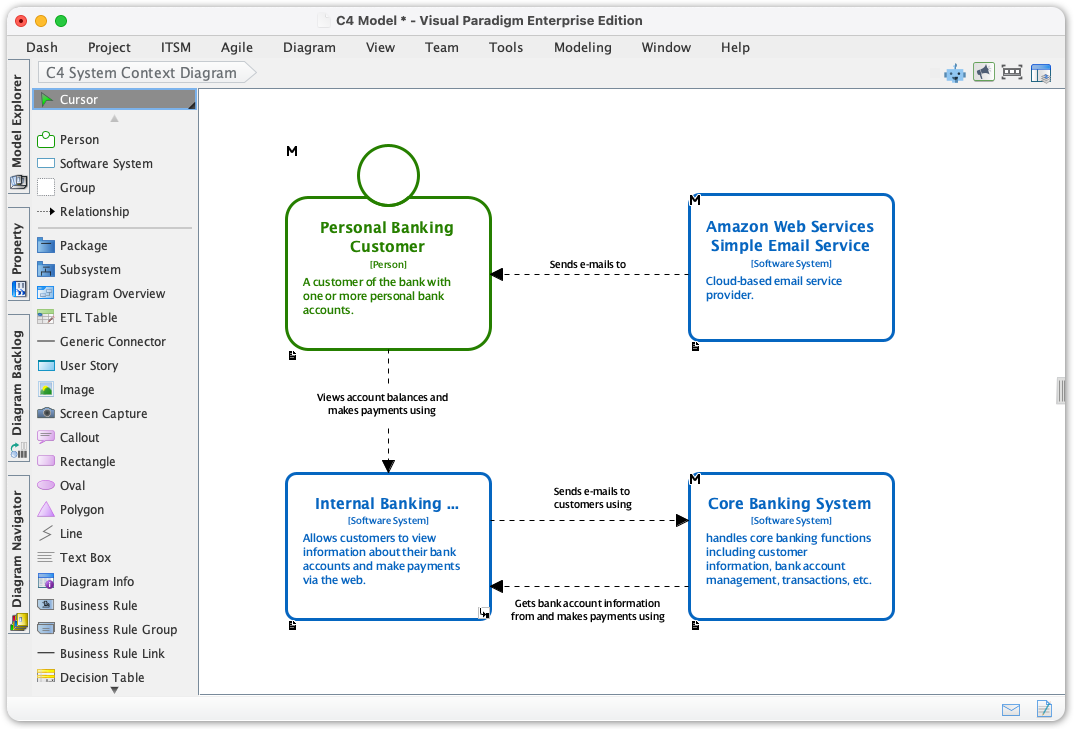
This is a C4 System Context diagram: it shows the people and external systems that interact with the Internal Banking system, rather than detailing its internal components.
-
Personal Banking Customer uses the banking system to view account balances and make payments via the web.
-
Internal Banking is the system being described. It enables customers to use online banking services.
-
Amazon Web Services Simple Email Service is an external service the banking system sends email notifications to.
-
Core Banking System is another external system. The banking system exchanges requests and banking information with it, such as customer details and account balances, and uses it in payment processing.
The arrows show the relationships and direction of communication. The exact wording on some arrow labels is too small to read, but the overall picture is that customers interact with online banking, which connects to the core banking system and an email service.
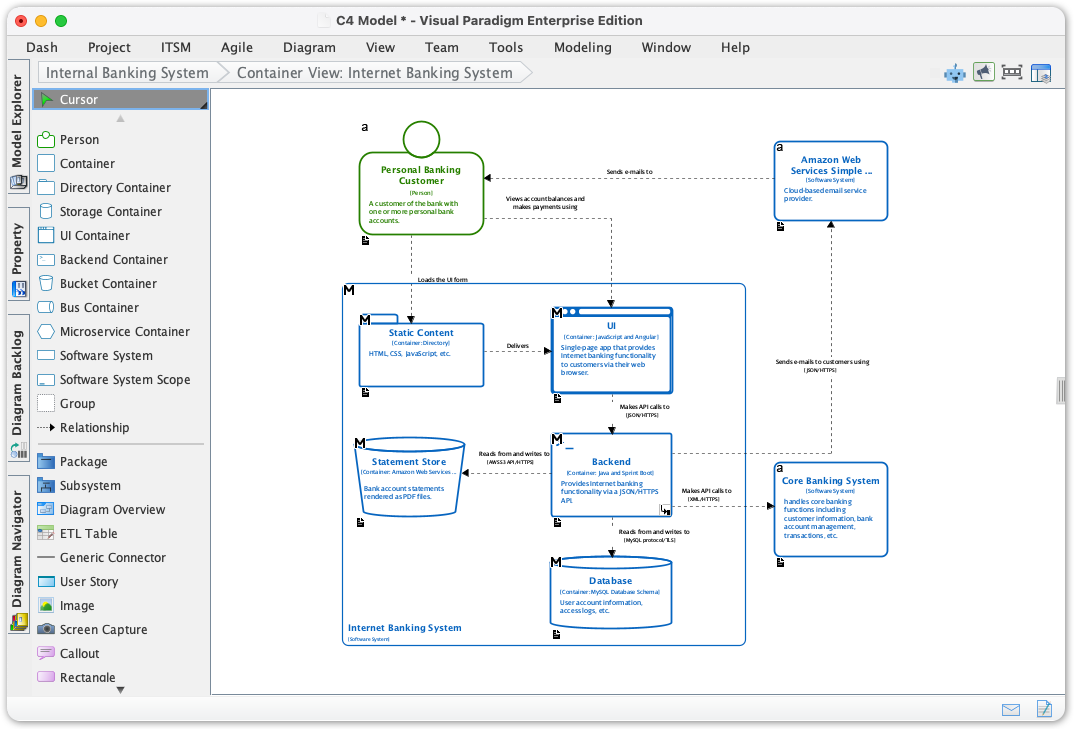
This is a C4 Container diagram for the Internet Banking System. It expands the system from the previous context diagram to show the main applications, services, and data stores inside it, plus the external systems they connect to.
Within the Internet Banking System boundary, the visible containers include a Web Application, a backend/API component, and data stores such as a Statement Store and a Database. The labels and descriptions inside several boxes are too small to read clearly, so I can’t identify every container or its specific technology with confidence.
The relationships suggest that the Personal Banking Customer uses the web application; the internal containers communicate with one another and with the data stores; and the system connects outward to Amazon Web Services Simple Email Service for email and the Core Banking System for banking information and operations.
So, compared with the previous diagram, this one shows how the banking system is organized internally, not just which external parties interact with it.
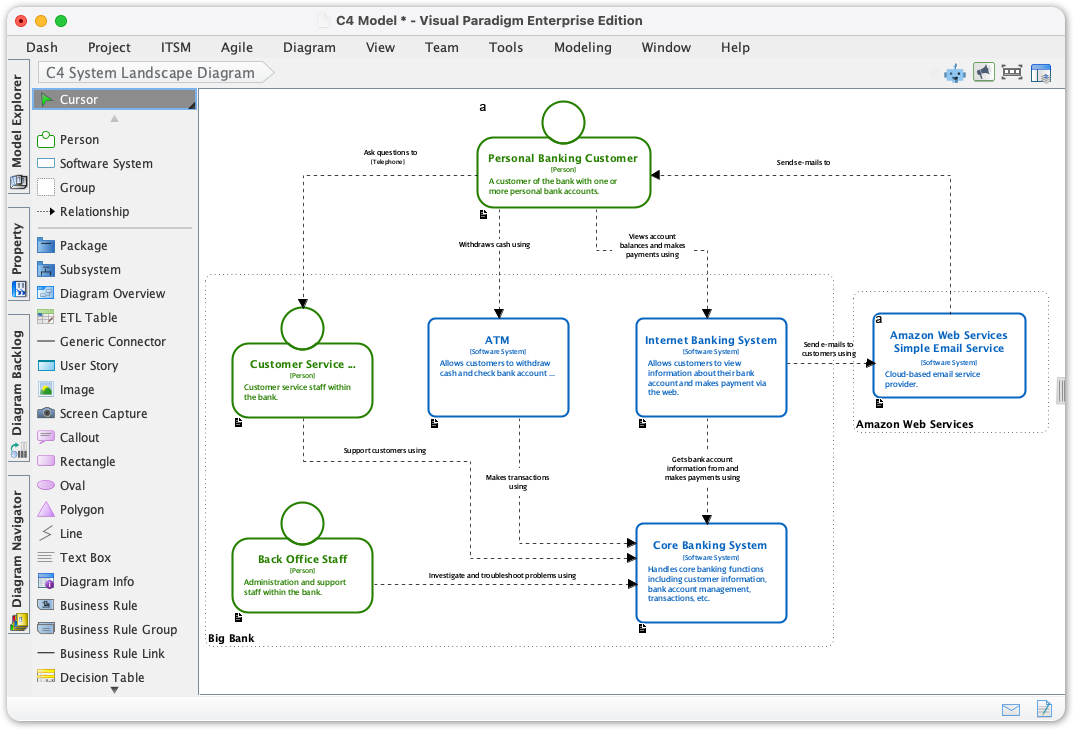
This is a C4 System Landscape diagram. It gives a broad view of the banking organization’s people and systems, rather than zooming in on one system’s internal design.
It shows:
-
Personal Banking Customer, who interacts with the ATM and Internet Banking System.
-
Back Office Staff, who use internal banking systems.
-
Customer Service System, ATM, Internet Banking System, and Core Banking System as parts of the bank’s wider technology landscape.
-
Amazon Web Services Simple Email Service, an external service used for email notifications.
The arrows indicate interactions and information exchanges—for example, the Internet Banking System connects to the Core Banking System, and the diagram shows staff and customers interacting with different systems. The exact relationship labels are too small to read, but the main point is that the diagram places several banking systems and user types in one organizational overview.
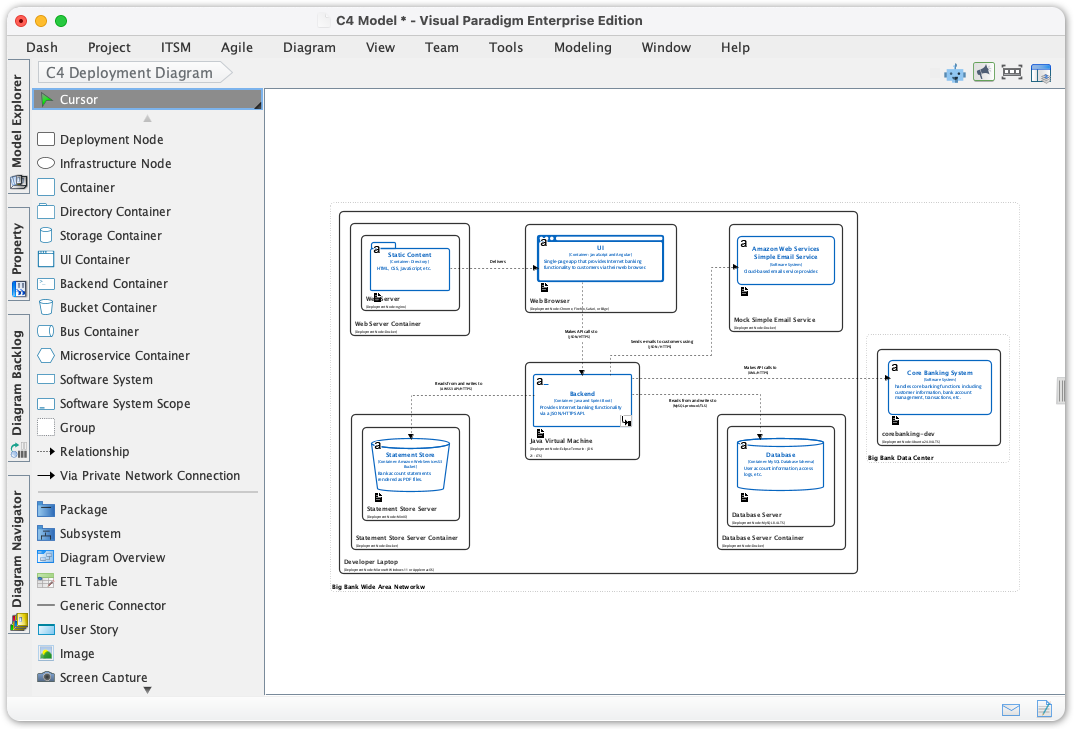
The dynamic diagram shows a C4 deployment view: software containers are placed inside deployment nodes, with a larger boundary grouping several parts of the system and a separate node on the right connected to that group. The connecting lines indicate communication between deployed parts.
In broad terms, it depicts a distributed system running across multiple environments or machines. The small boxes likely represent containers or services, while the larger boxes represent the infrastructure or deployment boundaries that host them.
The labels are too blurry to identify the specific systems, technologies, or communication protocols, so this is a structural interpretation rather than a component-by-component explanation.
This is a C4 Dynamic diagram showing the order of interactions for one banking-system scenario. Unlike the earlier diagrams, which showed system structure, this one focuses on what happens during a particular request.
The diagram appears to show a Personal Banking Customer making a request to the Internet Banking System. The request is handled by the Backend, which passes it through API components and interacts with a Database. The arrows and numbered labels indicate the sequence of calls and responses.
The small labels are difficult to read, so I can’t reliably tell which exact customer action is being illustrated—possibly a login or an account-information request. The key takeaway is the request path: customer → backend/API → database, with a response returning through the system.

Choosing Between VP Desktop and VP Online
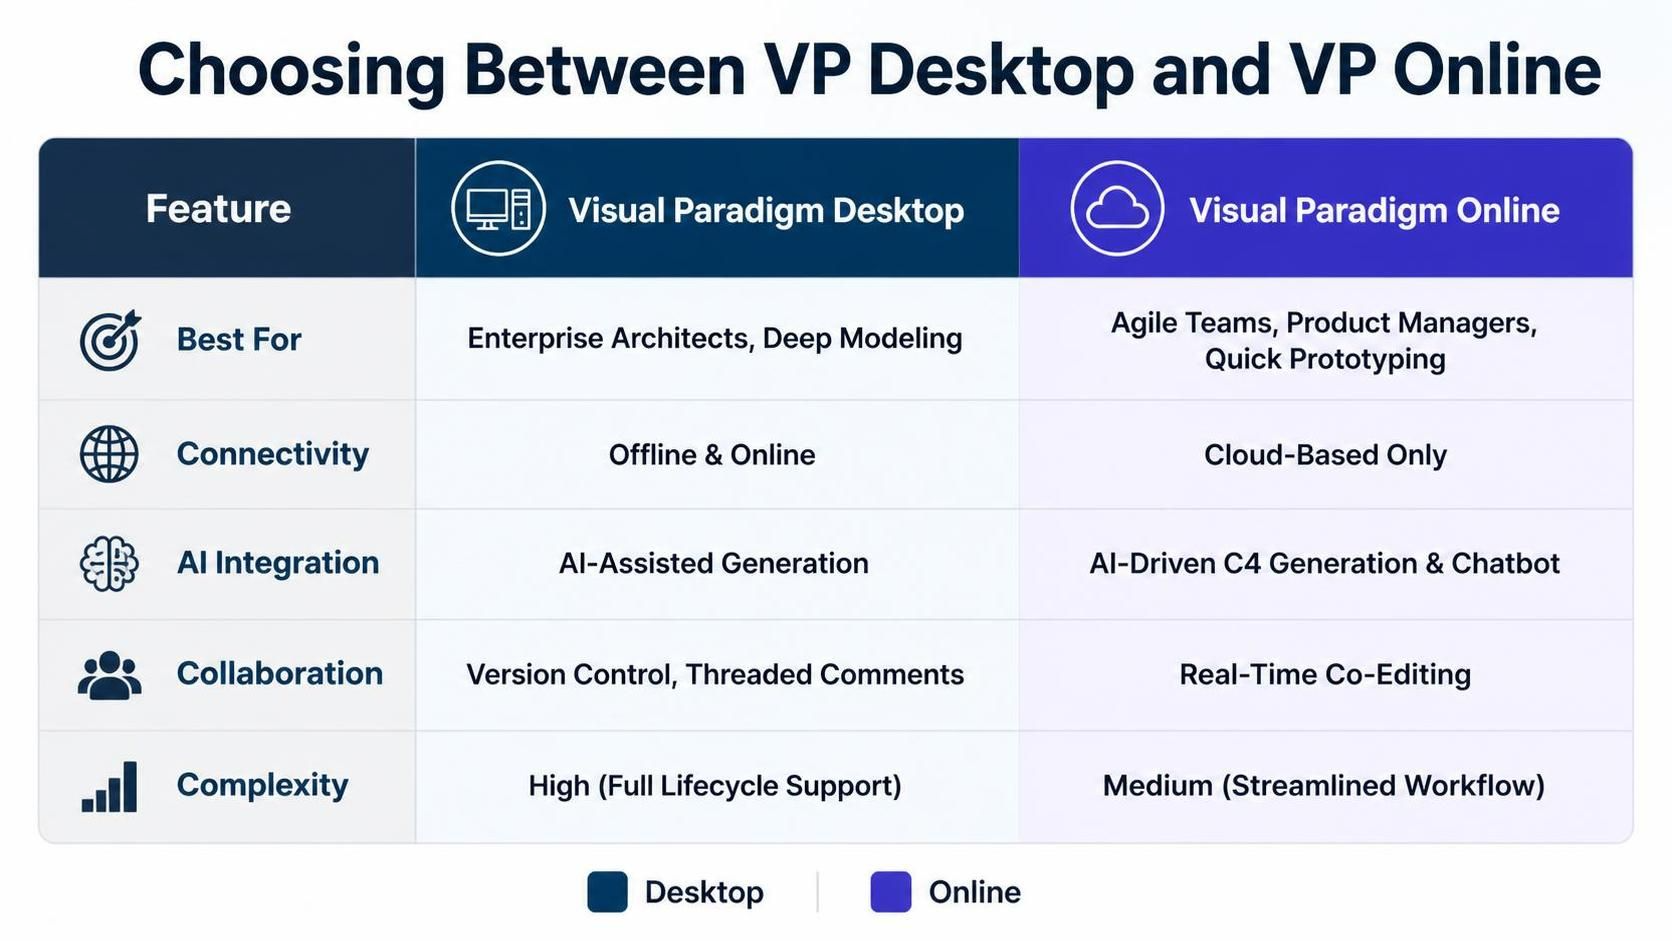
| Feature | Visual Paradigm Desktop | Visual Paradigm Online |
|---|---|---|
| Best For | Enterprise Architects, Deep Modeling | Agile Teams, Product Managers, Quick Prototyping |
| Connectivity | Offline & Online | Cloud-Based Only |
| AI Integration | AI-Assisted Generation | AI-Driven C4 Generation & Chatbot |
| Collaboration | Version Control, Threaded Comments | Real-Time Co-Editing |
| Complexity | High (Full Lifecycle Support) | Medium (Streamlined Workflow) |
Conclusion
Effective software architecture communication is no longer a luxury—it’s a necessity. By adopting a structured approach like the C4 model and leveraging powerful tools like Visual Paradigm, teams can bridge the gap between technical complexity and business clarity.
Whether you choose Visual Paradigm Desktop for its deep modeling capabilities and offline robustness or Visual Paradigm Online for its agile, AI-driven collaboration, you are investing in a clearer, more maintainable architectural future. Stop drawing static boxes and lines. Start building dynamic, AI-enhanced architectural narratives that drive your projects forward.